Instagram Statistics 2026: 60+ Fresh Numbers on Audience, Reels & Ads
We collected and refreshed the key Instagram numbers for 2026 — audience, demographics, engagement, Reels, advertising and shopping — with direct links to DataReportal, Statista, Sprout Social and Hootsuite.
In short: by 2026 Instagram has reached 3 billion monthly active users, remains one of the most gender-balanced platforms (roughly 50/50), generates around $76 billion in annual ad revenue, and Reels rack up more than 200 billion plays every single day. Below is a refreshed collection of 60+ numbers on how Instagram lives in 2026: audience, demographics, engagement, Reels, advertising, shopping and trends — with every key figure backed by a source link.
Statistics aren't dry numbers — they're a compass. They show who your audience is, which format earns reach, and where the platform is heading. So let's start with the most important thing — the size and makeup of the audience — and then move on to the practical metrics that marketers and brands rely on.

What, again? Traffic dropped and no sales? Then SEOquick will help you get it all back
We'll bring organic SEO traffic to your site from the Google and Bing search engines.
We'll carry out internal optimization and SEO promotion work. We'll improve your reputation and content. We'll do an audit and build up your link mass.
No black magic – only white-hat SEO methods!
Instagram's audience in 2026: how many users and how fast they grow
The headline number of 2026 is that Instagram has crossed 3 billion monthly active users. That milestone was reached in the third quarter of 2025, roughly three years after hitting 2 billion.
- 3 billion monthly active users (MAU) according to Meta.
- More than 500 million people open the app every day.
- Audience growth forecast for 2026 is around 3.5%, driven mainly by Asia, Latin America and Africa.
- Instagram ads can potentially reach about 1.74 billion people — the third largest ad reach in the world after Facebook and TikTok.
The largest national audiences, according to Statista: India — around 480 million users, the U.S. — 181 million, Brazil — 147 million. Detailed global social media figures are published annually in the DataReportal Digital report.
Demographics: age, gender and who really uses Instagram
Instagram remains one of the most gender-balanced platforms — which matters when planning ad campaigns.
- Global gender split is roughly 47–48% women and 52–53% men.
- The largest age group is 25–34 (about 31.6%), followed by 18–24 (about 29.5%).
- More than half of Instagram's entire global audience is under 35.
- In the U.S. the platform skews slightly female: around 55% women and 45% men; in India, by contrast, men dominate (about 67%).
The takeaway for business: the core audience is affluent young people and millennials aged 18–34, who account for more than 60% of the platform's total ad reach. If your product targets exactly this group, Instagram is an almost mandatory channel. We cover targeting setup in more detail in our piece on contextual and targeted advertising.
Engagement: what counts as normal in 2026
Engagement rate is the ratio of interactions (likes, comments, saves, shares) to reach or follower count. The key thing to understand in 2026: the bigger the account, the lower its average engagement rate.
- Nano accounts (1–10K followers): 4–6% engagement on average.
- Micro-influencers (10–100K): around 2–5%.
- Mid-tier accounts (100–500K): 1.5–3%.
- Large and mega accounts (1M+): 0.5–2%.
According to fresh benchmarks from Socialinsider and Sprout Social, average engagement by format looks like this: Reels — about 1.23% per post, carousels — 0.99%, plain photos — 0.70%. In other words, carousels and Reels consistently beat static photos.
To boost engagement without "bots", Alyona Polyukhovych put together 15 working techniques — watch them in the video below.
One of the key findings of 2026: when ranking Reels, Instagram's algorithm values shares to Direct 3–5x higher than likes. So content should be "shareable" — the kind people want to send to friends in their DMs.
Reels: the main engine of reach
Short vertical videos have firmly become the core of the platform. The numbers speak for themselves:
- Reels are played more than 200 billion times a day across Facebook and Instagram combined — double the figure from late 2024.
- Reels are reshared more than 4.5 billion times a day.
- Around 55% of Reels views come from users who don't follow the account — the main tool for attracting new audiences.
- Reels consistently reach 2–3x more accounts than ordinary photo posts.
- Reels account for roughly half of all time people spend on Instagram.
The practical takeaway: if you want to grow, short video is unavoidable. Reels work for reach and acquisition, while feed posts and carousels build retention and community. If you're just getting into the format, start with our guide to video marketing.
Advertising on Instagram: reach, CPM and revenue
Instagram has long been Meta's primary advertising platform. The money in the system is enormous:
- Instagram's annual ad revenue in 2026 is estimated at roughly $76 billion (per eMarketer's revised forecast).
- Global CPM (cost per 1,000 impressions) rose to about $9.5–9.7, up roughly 11% year over year.
- Ad reach is around 1.74 billion people; more than 60% of that reach is users aged 18–34.
- Instagram's CPM is consistently higher than Facebook's — a sign that Instagram has become Meta's priority platform.
A separate trend is AI tools. According to Hootsuite, AI-powered Advantage+ campaigns and automatic creative generation are already used by a significant share of advertisers. For ads to pay off, it's important to tie them to a solid landing page and SEO — we write about this in our section on search engine promotion.
Shopping and Stories: how Instagram sells
Instagram long ago turned from a photo gallery into a marketplace. Stories, meanwhile, remain a key format for engagement and "warming up" the audience.
- More than 500 million accounts open Stories every day; 7 in 10 users watch at least one Story within 24 hours.
- Around 50% of users have visited a website to buy something they saw in Stories.
- 58% of users become more interested in a brand after seeing it in Stories.
- About 90% of Instagram users follow at least one business account.
- Average time in the app is about 33 minutes a day.
For business this means: a business profile, up-to-date Stories and a clear path to purchase are no longer optional — they're the bare minimum. To learn how to design and grow a profile, read our guide to Instagram promotion.
Instagram in Ukraine: the 2025–2026 numbers
For Ukrainian business, Instagram is one of the main channels. The latest data:
- Around 12.6–12.7 million Ukrainian Instagram users (end of 2025).
- That's equivalent to about 29–32% of the population.
- Among Ukraine's adult ad audience, around 62% are women and 38% are men.
- The largest age group is 25–34 (about 3.6 million people).
- From July to October 2025, Ukraine's Instagram ad audience grew by roughly 300 thousand people (+2.4%).
Source — the DataReportal Digital 2026: Ukraine report. The female skew of the Ukrainian audience is an important nuance for brands in beauty, fashion, home goods and kids' niches.
Instagram trends for 2026
Where is the platform heading? A few directions worth keeping in mind when planning content:
- AI has become the norm, but "humanity" is valued. Per a Sprout Social survey, 56% of consumers encounter "AI slop" in their feed often or very often — the winners are brands that keep a human tone.
- The creator "middle class" is growing. Around 45.6% of creators earn $10–100K a year, forming a stable monetization segment.
- Carousels are regaining weight. Their engagement has noticeably risen year over year, while the share of static photos is declining.
- Direct shares are the algorithm's main currency. Make content people want to share in DMs.
- A video-first approach. Reels volume keeps growing while the number of ordinary photo posts is falling.
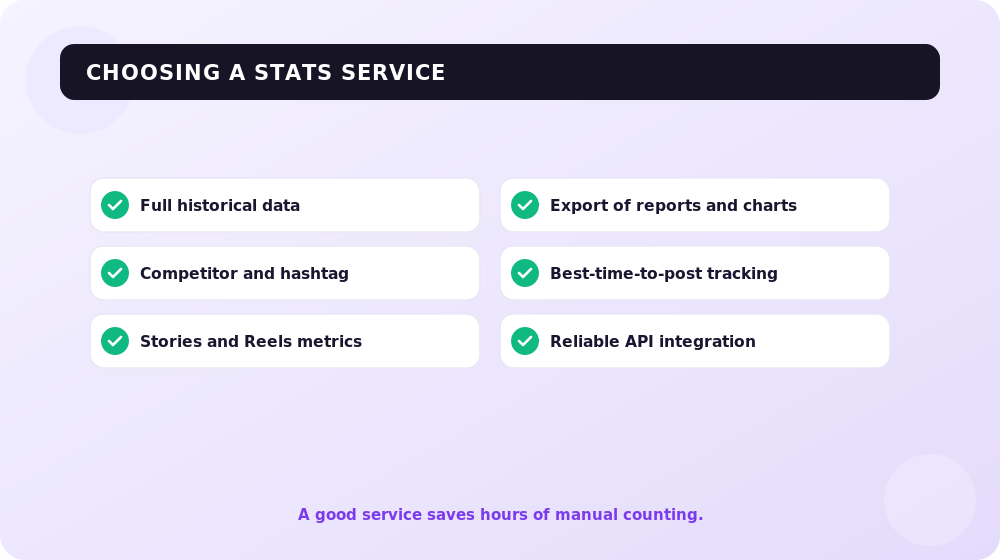
How to collect and read your profile's statistics
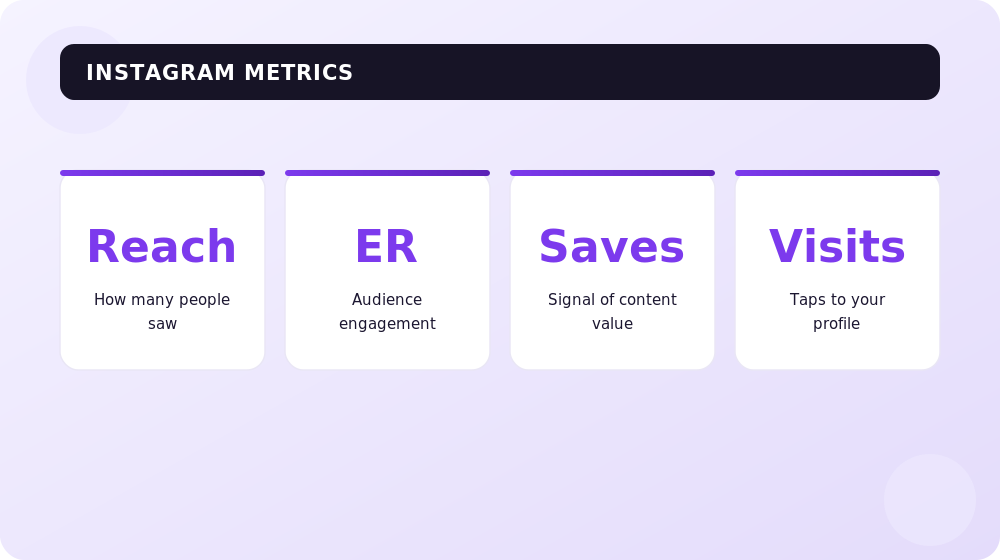
All the basic analytics are already built into Instagram for business accounts — third-party services are just an add-on on top. What's important to track regularly:
- Reach and impressions — how many unique people saw your content and how many times.
- Engagement — likes, comments, saves and, most importantly, shares to Direct.
- Audience demographics — age, gender, location and active hours.
- Reels and Stories performance — completion rate, taps, replies.
- Profile actions — link clicks, leads, messages.
The key principle: don't look at absolute numbers, look at trends and ratios. Is the share of new viewers in your Reels growing? Which format earns more saves? It's precisely these conclusions that turn statistics into strategy.
Frequently asked questions about Instagram statistics
How many users does Instagram have in 2026?
About 3 billion monthly active users, of whom more than 500 million open the app daily. The 3 billion milestone was reached in 2025.
What's a normal engagement rate on Instagram in 2026?
It depends on account size: for nano accounts (1–10K) the norm is 4–6%, for micro (10–100K) it's 2–5%, for large ones (1M+) it's 0.5–2%. By format, Reels and carousels outperform plain photos.
Do Reels really get more reach than posts?
Yes. Reels reach 2–3x more accounts than photo posts, and about 55% of their views come from non-followers — making them the main tool for attracting new audiences.
How many Instagram users are there in Ukraine?
Around 12.6–12.7 million at the end of 2025, roughly 29–32% of the population. The audience is predominantly female (about 62%), and the largest age group is 25–34.
How much does Instagram advertising cost?
The global average CPM (cost per 1,000 impressions) in 2025–2026 is around $9.5–9.7 and keeps rising. The exact cost depends on niche, geography, competition and creative quality.
Which content format is the priority in 2026?
Video. Reels take up about half of all time spent in the app and are the main reach channel, while the algorithm most strongly rewards content that gets shared in Direct.
Conclusions
Instagram in 2026 means 3 billion users, balanced demographics, the dominance of short video and an advertising ecosystem worth nearly $76 billion a year. For business this means one thing: you can't ignore the platform, but you also can no longer work on it "by feel".
Rely on the numbers — track the dynamics of reach, engagement and audience behavior, bet on Reels and "shareable" content, and make decisions based on data rather than intuition. That's exactly how statistics turn from a set of numbers into real growth.
Recommended articles on the topic

Broken Links and Redirect Chains: Clearing 3XX, 4XX and 5XX Without Bleeding Link Equity
Broken links and extra redirects quietly steal traffic, crawl budget and link equity — and they push your pages out of AI answers. Here's what actually goes wrong and how to get your hops down to zero.
Read →
Merchant Center for AI Mode: Getting Your Product Feed Ready for Conversational Shopping in 2026
Google AI Mode is reshaping product search and a plain feed no longer cuts it. Here are the new Merchant Center attributes, why stores get banned, and where to start.
Read →
Image SEO Optimization: alt, Dimensions and Weight for Core Web Vitals
How to optimize images for SEO in 2026: why alt text matters, how width and height stop layout shifts (CLS), which formats (WebP, AVIF) to use, and how not to break LCP with lazy loading. A guide from SEOquick.
Read →Want to apply this to your site?
We will review the current situation, find the first growth levers, and suggest a practical working format.