SE Ranking vs Semrush, tested on real data
We're partners with both, so instead of a feature table we checked them against Search Console for 26 sites: whose traffic, search volume and trends are closer to reality, what costs less, and which one works better with AI assistants through its API.


I will look at your site and answer your questions on the topic of this article. 30 minutes, no slide decks, no pressure.
Book a consultationShort version. We ran this test mostly on Ukraine, our home market, plus eight sites abroad. On the Ukrainian data the two tools are neck and neck; on US and European sites Semrush came out more accurate; on search volume and price SE Ranking wins. And neither one can reliably tell you whether traffic went up or down month to month, so pull your own numbers from Google Search Console anyway.
I didn't feel like retelling pricing pages. I took Search Console data for 26 sites (our clients' and our own), exported what both tools think about those same sites, and checked it against real clicks. On top of that, 261 queries where clients rank #1: there, Search Console impressions are nearly equal to demand, so you can see whose search volume is closer to the truth. Below you'll find five rounds, pricing, a long chapter on APIs and how AI assistants work with both tools, and a test you can repeat on your own site in fifteen minutes.
Key findings
| What we compared | Who's closer to reality | Score |
|---|---|---|
| Traffic of Ukrainian sites vs. Search Console clicks | tie | SE Ranking closer on 10 sites out of 19, Semrush on 9 |
| Traffic of sites outside Ukraine (US, Europe, Asia) | Semrush | 7 out of 8 |
| How many keywords it sees for a Ukrainian site | SE Ranking | 18.8x more (median) |
| Search volume vs. real impressions at position 1 | SE Ranking | within 2x: 68% vs. 57% |
| Month-to-month ups and downs | neither | direction matches in roughly half the months for both |
| Rank tracking price | SE Ranking | 3–4x cheaper per keyword |
| API and AI-assistant workflows | SE Ranking | access included in the base plan; Semrush only from the Business plan up |
- Both databases lowball. Median: SE Ranking shows 38% of real traffic, Semrush 56%. Each of them landed within 2x of reality on only 10 sites out of 27.
- Ukrainian is a shared blind spot. Of 111 Ukrainian-language queries where our clients rank first, SE Ranking knows 51, Semrush 58, and 35 aren't in either database.
- We're partners with both tools. That's why you'll see the strengths and the weak spots of each one below, with numbers.
We're partners with both, and here's what that means for you
SEOquick is a partner of SE Ranking and Semrush. These are referral links: if you subscribe through them, we get a commission and you pay exactly what you'd pay without them. We pay for both subscriptions ourselves, our team works in them every day, and every screenshot in this article comes from our own accounts.
There's an upside in that for you. When an author earns from only one tool, the comparison almost always ends with that tool winning. We honestly don't care which one you pick, so I can be blunt: here's where SE Ranking was off by 93x, and here's where Semrush showed a decline while the site was actually growing.
One more caveat. Our clients' Search Console data was trusted to us, and we agreed not to disclose it, so client sites are labeled by niche: “dental clinic,” “shoe store,” “generator rental.” Our own sites, seoquick.com.ua and our SEO tool unmiss.com, I'll name outright.
Who writes SE Ranking vs Semrush comparisons
The query “se ranking vs semrush” gets 390 searches a month in US Google, plus another 210 for “semrush vs se ranking.” In Russian and Ukrainian there's no demand for this comparison at all: people back home just search for the brand names. So nearly everything anyone reads while choosing between these two, Ukrainian business owners included, is in English. I pulled up the google.com results on October 23, 2026.
Reddit is #1. #2 is SE Ranking's own comparison page. At #9 there's an SE Ranking ad for the very same query: the vendor pays to show up twice in results about itself. After that you get an agency, a competing vendor (seoClarity), affiliate-funded publications (stylefactoryproductions, demandsage), and some eighty more pages just like them. Semrush has no comparison page of its own in the top 20, even though the company isn't short on blogs: Exploding Topics, sitting at #13, is owned by Semrush too.
Almost all of these pages follow one template: a feature table, pricing, and the verdict “Semrush is more powerful, SE Ranking is cheaper.” Not one of them checks how close the tools' numbers are to reality. And that's the only question worth paying either of them for.
How we tested
The only person who knows the right answer to “how much traffic does this site get” is the site owner. We have Search Console access for several hundred projects, which is a rare chance to look at both tools from the side of the truth instead of the side of their marketing.
| What | Source of truth | Source of the estimate | Sample |
|---|---|---|---|
| Site traffic in a country | Search Console: Google web search clicks from that country, Sep 21–Oct 20, 2026 | SE Ranking: domain overview by country; Semrush: domain organic traffic by country, snapshot taken Oct 22–23, 2026 | 27 “site + country” pairs: 19 in Ukraine, 8 abroad |
| Trends | Search Console by month, Aug 2025–Sep 2026 | Domain history in both tools | 8 sites, 14 months |
| Search volume | Search Console impressions for September, queries with an average position of 1.5 or better | Search volume in both tools, Ukraine database | 261 queries from 12 sites |
Why impressions at #1 can stand in for demand: when a site ranks first, it gets shown to almost everyone who typed the query. It's not a perfect measure (some impressions go to mobile results with different features, and Google hides some queries in the report), but it's closer to reality than any model. If a site averages 1.4, it's sometimes in second place, and impressions run a little below demand. Which means that if a tool reports a search volume lower than the impressions, it's definitely lowballing.
The numbers from both tools are the same ones you'd see in their interfaces, pulled on the same days: October 22–23, 2026.
Traffic for Ukrainian sites: a tie
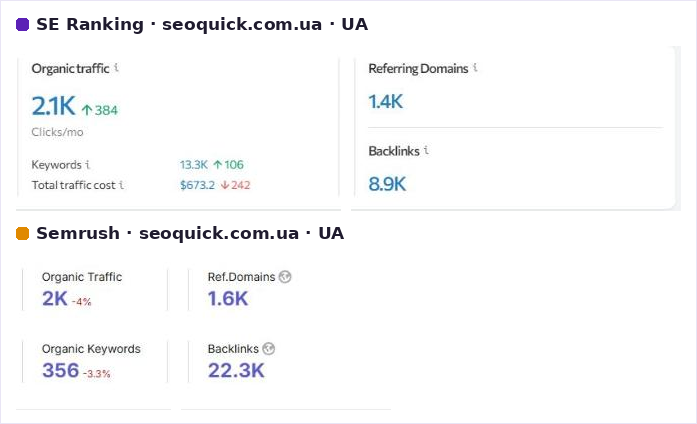
I'll start with our own site, because there I can show everything without caveats. Over 30 days Search Console logged 1,593 clicks from Ukraine. Semrush puts seoquick.com.ua organic traffic at 1,616 visits: a 1% miss, which is better than I expected. SE Ranking says 2,144, so +35%.
One site could be a lucky guess, so next come 18 client sites. And that's where the picture falls apart.
Traffic estimates vs Google Search Console
27 site-and-country pairs: what SE Ranking and Semrush report, and how many clicks Search Console actually recorded over 30 days. Log scale: each gridline is ten times the previous one. Hover or tap a dot.
Both tools usually come in low. Median: SE Ranking shows 38% of real traffic, Semrush 56%. In Ukraine the closer tool flips site by site (10 to 9); in the foreign databases Semrush is closer in 7 of 8 cases.
Show the data as a table
| Niche | Database | GSC clicks | SE Ranking | Semrush | SER/GSC | SEM/GSC | SER keywords | SEM keywords |
|---|---|---|---|---|---|---|---|---|
| Education portal | UA | 8,073,840 | 589,927 | 4,646,811 | 0.07 | 0.58 | 54,283 | 81,961 |
| News media | LV | 389,900 | 59,115 | 159,526 | 0.15 | 0.41 | 6,542 | 4,413 |
| Car parts | UA | 35,276 | 532 | 148 | 0.02 | 0.00 | 43,942 | 247 |
| Dental clinic | UA | 28,173 | 20,910 | 26,360 | 0.74 | 0.94 | 55,684 | 6,757 |
| Furniture store | PL | 22,439 | 8,605 | 37,254 | 0.38 | 1.66 | 6,408 | 14,944 |
| Jewellery store | UA | 15,449 | 14,002 | 37,207 | 0.91 | 2.41 | 44,823 | 3,371 |
| Shoe store | UA | 9,172 | 14,665 | 26,885 | 1.60 | 2.93 | 20,724 | 1,518 |
| Skates and scooters | UA | 7,858 | 4,638 | 13,298 | 0.59 | 1.69 | 21,568 | 1,150 |
| Generator rental | UA | 4,259 | 2,302 | 2,364 | 0.54 | 0.56 | 7,088 | 666 |
| Appliance repair | UA | 4,215 | 1,016 | 596 | 0.24 | 0.14 | 12,076 | 398 |
| Car stereos | UA | 2,962 | 760 | 365 | 0.26 | 0.12 | 5,729 | 60 |
| Windows and doors | UA | 2,784 | 630 | 1,228 | 0.23 | 0.44 | 7,376 | 318 |
| Car service | UA | 2,200 | 539 | 410 | 0.24 | 0.19 | 3,168 | 155 |
| unmiss.com (our SEO tool) | IN | 1,888 | 922 | 2,543 | 0.49 | 1.35 | 1,074 | 104 |
| Tours | TH | 1,597 | 1,806 | 5,772 | 1.13 | 3.61 | 332 | 2,031 |
| seoquick.com.ua (our site) | UA | 1,593 | 2,144 | 1,616 | 1.35 | 1.01 | 13,273 | 331 |
| Yacht cruises | GR | 1,509 | 185 | 2,066 | 0.12 | 1.37 | 417 | 341 |
| Furniture fittings | UA | 1,133 | 806 | 737 | 0.71 | 0.65 | 3,895 | 188 |
| Medical imaging | UA | 703 | 83 | 331 | 0.12 | 0.47 | 173 | 67 |
| Vet pharmacy | UK | 625 | 151 | 174 | 0.24 | 0.28 | 2,086 | 279 |
| Vet pharmacy | US | 543 | 160 | 169 | 0.29 | 0.31 | 3,271 | 518 |
| Aquarium supplies | UA | 394 | 322 | 153 | 0.82 | 0.39 | 1,187 | 61 |
| Tiles | UA | 360 | 119 | 10 | 0.33 | 0.03 | 5,142 | 100 |
| B2B services | UA | 235 | 165 | 254 | 0.70 | 1.08 | 210 | 20 |
| Popular science media | UA | 185 | 73 | 554 | 0.39 | 2.99 | 588 | 194 |
| Needlework supplies | US | 85 | 647 | 31 | 7.61 | 0.36 | 388 | 169 |
| Ceiling manufacturer | UA | 77 | 2 | 3 | 0.03 | 0.04 | 73 | 9 |
In Ukraine the score is 10:9 for SE Ranking, but that win means next to nothing: both tools make huge errors, in both directions. A few examples worth remembering:
- Education portal. 8.07 million clicks a month. Semrush sees 4.65 million (58%), SE Ranking 590K (7%). If you sized up this market with SE Ranking, you'd underestimate the leader 14 times over.
- Car parts. 35K clicks. SE Ranking shows 532, Semrush 148. That's misses of 66x and 238x. The store lives off a long tail of part numbers and SKUs, and those queries barely exist in either database.
- Shoe store. 9,172 clicks. SE Ranking gives 14,665 (+60%), Semrush 26,885 (2.9x too high). Here, for a change, both overshot.
- Dental clinic. 28K clicks; Semrush says 26K, SE Ranking 21K. The best case for both.
On average across Ukraine, SE Ranking shows 39% of real traffic and Semrush 56%. The business takeaway is simple. Comparing yourself to a competitor inside one tool is fine: the error is similar for both sites. Comparing a competitor's absolute number to your own Search Console isn't: you'd be comparing a model to reality.
Traffic outside Ukraine: Semrush is stronger
For some of our clients, Ukraine isn't the main market: a Polish furniture store, a Latvian news outlet, yacht cruises in Greece, tours in Thailand, a Ukrainian vet pharmacy with customers in the UK and US, a needlework supply store in the US. Plus our own unmiss.com, whose top country is India.
On these eight pairs, Semrush is closer to Search Console in seven. Median: Semrush shows 88% of real traffic, SE Ranking 34%. If you're reading this from the US, this is the round that matters to you. The yacht cruises make the gap especially obvious: 1,509 real clicks from Greece, Semrush says 2,066, SE Ranking 185.
The one exception is the Thailand tours: SE Ranking gave 1,806 against 1,597 real clicks, while Semrush said 5,772. But overall, if your market is the US, Europe, or another country where Semrush has been collecting data the longest, its estimates are closer. In our piece on Ahrefs alternatives we got the same result on one site; now it holds up on eight.
How many keywords each one sees
Here the gap isn't measured in percent anymore, it's measured in orders of magnitude. For Ukrainian sites, SE Ranking finds on average 18.8x more top-100 keywords than Semrush. For our site it's 13,273 vs. 331. For a car stereo store, 5,729 vs. 60. For the car parts store, 43,942 vs. 247.
Switch the chart above to “Keyword count” and you'll see it right away: SE Ranking's purple dots sit to the right of the orange ones on almost every Ukrainian site. Abroad, the gap shrinks to 1.9x.
What that means in practice. For keyword research and mining competitor ideas in Ukraine, SE Ranking is more useful: it sees a tail Semrush simply doesn't have. For traffic estimates, more keywords doesn't mean more accurate: for that same car parts store, 44K keywords in SE Ranking produced an estimate of 532 visits against 35K real ones. Thousands of rankings at the bottom of the top 100 don't bring clicks.
A year ago I ran a similar test on a Polish site and wrote about it in our Telegram channel:
“🏆 On backlinks I analyzed all the services, almost all of them lied - but for cleanest report first place goes to .... SERANKING. Reason is simple - most services show a ton of "generated junk links".”
In that same post Semrush saw 15,800 keywords for Poland and SE Ranking 9,500. Today, for the Polish furniture store, the picture hasn't changed: 14,944 in Semrush vs. 6,408 in SE Ranking. Which database is stronger depends on the country, and that's the single most important thing to know before you buy.
Search volume vs. real impressions
Search volume is the number people look at most. It's how you pick topics, size up potential, and decide whether a niche is worth entering at all. So I checked it separately on 261 queries where our clients ranked first in September.
Search volume vs real impressions
261 queries where our clients ranked first in Ukraine in September 2026. At position one, Search Console impressions are close to actual demand, so this is a fair test of search volume. A dot on the diagonal means the tool got it right; inside the purple band it is off by less than 2×; red dots at the bottom mean the tool has no data.
SE Ranking: data for 161 of 261 queries, 110 within 2×; no data for 100. Of 111 Ukrainian-language queries SE Ranking knows 51.
Semrush: data for 165 of 261 queries, 94 within 2×; no data for 96. Of 111 Ukrainian-language queries Semrush knows 58.
Show the summary as a table
| Group | Queries | SE Ranking: has data | SE Ranking: within 2× | Semrush: has data | Semrush: within 2× | Neither has data |
|---|---|---|---|---|---|---|
| All queries | 261 | 161 | 110 | 165 | 94 | 51 |
| Ukrainian-language | 111 | 51 | 38 | 58 | 34 | 35 |
| Russian and shared | 150 | 110 | 72 | 107 | 60 | 16 |
SE Ranking has a volume for 161 of those queries, and in 110 cases it's within 2x of real impressions. That's 68%. Semrush has data for 165 queries, 94 of them within 2x, or 57%. On the 116 queries both tools know, SE Ranking is closer in 60 cases and Semrush in 55: nearly even, with a slight edge.
The misses are where it gets interesting. For example:
| Query | Impressions at #1 in September | SE Ranking | Semrush |
|---|---|---|---|
| прищ на язиці (pimple on the tongue) | 583 | 10 | 584 |
| желтые сопли (yellow snot) | 523 | 35 | 500 |
| лімфовузли на шиї (lymph nodes in the neck) | 100 | 1,300 | 1,907 |
| парацетамол при зубному болі (paracetamol for toothache) | 88 | 90 | 8 |
| расход топлива генератора 3 квт (fuel consumption of a 3 kW generator) | 156 | 480 | 157 |
| сердолик камень магические свойства (carnelian stone magical properties) | 40 | 50 | 540 |
In the first two rows Semrush is practically dead on, while SE Ranking is off by 15–60x. In the fourth and fifth it's the other way around, and in the last row Semrush overshoots 13x. I couldn't find a pattern by query type, except one: both tools are weaker on rare Ukrainian-language phrasings. That's the next section.
Branded queries are a story of their own. Semrush merges brand spelling variants into one cluster and shows one big number for all of them: for the dental clinic's brand, it's 7x the real impressions of the most common spelling. SE Ranking counts each variant separately and knows nothing about some of them. For gauging your own brand, both are useless: check Search Console.
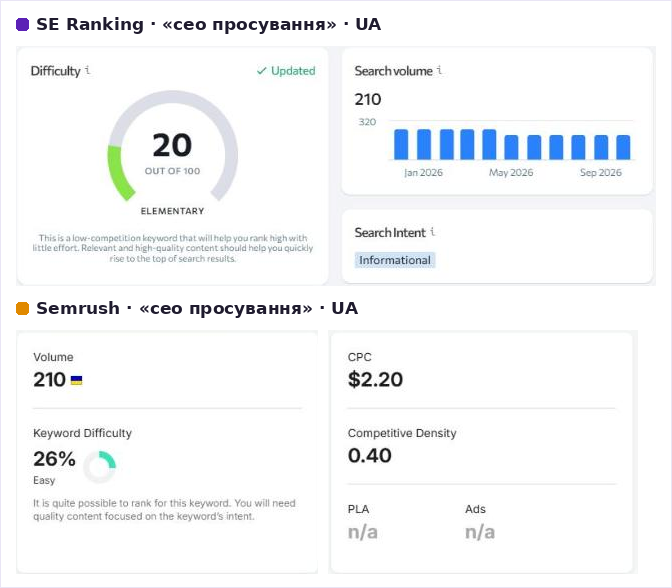
Ukrainian-language queries: a blind spot for both
Of the 261 queries, 111 are written in Ukrainian (they contain the letters і, ї, є, or ґ). That's exactly where both tools sag the most:
| Queries | Count | SE Ranking knows | Semrush knows | Neither has it |
|---|---|---|---|---|
| Ukrainian-language | 111 | 51 (46%) | 58 (52%) | 35 (32%) |
| Russian and language-neutral | 150 | 110 (73%) | 107 (71%) | 16 (11%) |
One in three Ukrainian-language queries that bring a real site hundreds of impressions a month is missing from both databases. «білий наліт на язиці фото» (white coating on the tongue photo): 223 impressions; «як виглядає свищ фото» (what a fistula looks like photo): 130; «вавки в роті чим лікувати» (how to treat mouth sores): 97. As far as the tools are concerned, these queries don't exist.
What to do about it in practice (and this goes for any smaller-language market, not just Ukraine). When you build a keyword list for the Ukrainian-language version of a site, don't toss a phrase just because the tool says it has “no volume.” Cross-check it against Google autocomplete, against Search Console for the site's other language version, and against our free keyword generator. And don't trust a contractor's report that says the Ukrainian version of a site “has no demand”: most likely their tool just has no data for it.
Month-to-month trends: a coin toss for both
This is the most uncomfortable part. What an owner cares about most isn't the traffic level, it's the direction: are we growing or shrinking, did last month's work pay off. I took eight sites and 14 months of history in both tools and compared them with Search Console.
Month by month: who catches the ups and downs
Each line is scaled to its own 14-month median (100 = a normal month), so you see the shape, not the level. Black is real Search Console clicks from Ukraine. Pick a site.
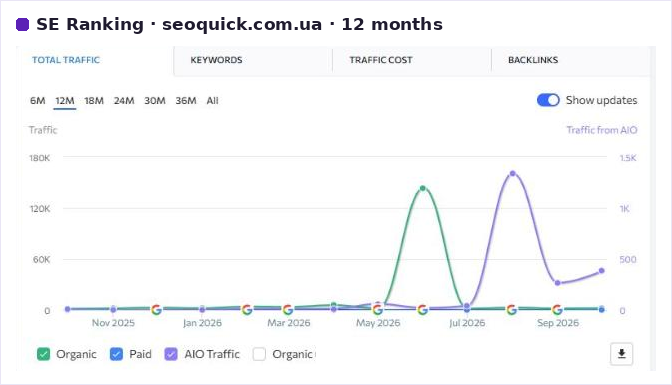
In June 2026 SE Ranking gave us 143,866 visits; Search Console recorded 1,490 clicks. Up/down direction matched Search Console in 7 of 13 months for SE Ranking and 6 of 13 for Semrush.
SE Ranking caught the winter blackout peak; Semrush showed a smooth decline. Up/down direction matched Search Console in 8 of 13 months for SE Ranking and 3 of 13 for Semrush.
Semrush shows traffic halving while real clicks grew 88% over the year. Up/down direction matched Search Console in 7 of 13 months for SE Ranking and 5 of 13 for Semrush.
Semrush caught the April peak exactly; SE Ranking put the peak in June, when real traffic was already falling. Up/down direction matched Search Console in 5 of 13 months for SE Ranking and 11 of 13 for Semrush.
Only Semrush sees the slow decline; SE Ranking drew growth until summer. Up/down direction matched Search Console in 7 of 13 months for SE Ranking and 7 of 13 for Semrush.
Both tools caught the spring 2026 growth: the best case in the set. Up/down direction matched Search Console in 8 of 13 months for SE Ranking and 10 of 13 for Semrush.
Show the data as a table
| Niche | Source | Aug 25 | Sep | Oct | Nov | Dec | Jan 26 | Feb | Mar | Apr | May | Jun | Jul | Aug 26 | Sep |
|---|---|---|---|---|---|---|---|---|---|---|---|---|---|---|---|
| seoquick.com.ua (our site) | Search Console | 1,421 | 1,599 | 1,845 | 2,074 | 1,765 | 1,543 | 1,449 | 1,707 | 1,939 | 1,806 | 1,490 | 1,323 | 1,474 | 1,951 |
| seoquick.com.ua (our site) | SE Ranking | 1,554 | 1,036 | 1,419 | 1,838 | 2,740 | 2,151 | 4,044 | 3,502 | 5,780 | 1,967 | 143,866 | 1,543 | 2,828 | 1,760 |
| seoquick.com.ua (our site) | Semrush | 1,372 | 1,044 | 959 | 1,066 | 1,085 | 1,429 | 1,995 | 1,824 | 1,942 | 1,719 | 2,601 | 1,179 | 1,597 | 1,735 |
| Generator rental | Search Console | 5,204 | 6,720 | 9,736 | 13,369 | 10,938 | 18,245 | 12,000 | 3,262 | 2,276 | 1,445 | 1,675 | 2,956 | 3,085 | 3,311 |
| Generator rental | SE Ranking | 3,467 | 4,755 | 2,927 | 5,693 | 5,967 | 6,891 | 6,514 | 6,086 | 5,876 | 4,789 | 4,923 | 4,050 | 3,773 | 2,692 |
| Generator rental | Semrush | 5,433 | 5,514 | 4,658 | 3,678 | 3,535 | 2,171 | 2,581 | 3,018 | 2,841 | 2,861 | 2,831 | 2,718 | 2,417 | 2,198 |
| Windows and doors | Search Console | 1,629 | 1,629 | 1,547 | 1,276 | 1,295 | 1,525 | 1,548 | 1,977 | 1,986 | 2,304 | 2,412 | 2,534 | 2,354 | 2,860 |
| Windows and doors | SE Ranking | 459 | 513 | 452 | 826 | 835 | 1,089 | 854 | 941 | 893 | 613 | 677 | 794 | 959 | 1,082 |
| Windows and doors | Semrush | 2,158 | 1,543 | 2,525 | 2,587 | 2,793 | 2,961 | 1,450 | 1,232 | 1,004 | 1,451 | 1,427 | 1,552 | 1,452 | 1,303 |
| Dental clinic | Search Console | 41,221 | 37,633 | 39,097 | 34,225 | 40,424 | 45,104 | 44,423 | 47,975 | 52,394 | 47,590 | 38,104 | 35,000 | 31,712 | 29,498 |
| Dental clinic | SE Ranking | 16,605 | 14,379 | 15,666 | 23,187 | 13,506 | 31,898 | 33,084 | 31,698 | 30,836 | 35,505 | 36,305 | 27,887 | 31,387 | 27,699 |
| Dental clinic | Semrush | 39,136 | 44,663 | 39,493 | 28,480 | 37,073 | 40,327 | 34,082 | 34,553 | 47,599 | 45,548 | 41,580 | 32,935 | 30,758 | 27,408 |
| Jewellery store | Search Console | 28,474 | 26,377 | 25,879 | 22,590 | 23,954 | 21,460 | 21,540 | 21,129 | 22,045 | 22,904 | 20,513 | 21,211 | 20,743 | 18,180 |
| Jewellery store | SE Ranking | 16,245 | 15,585 | 14,285 | 20,426 | 18,952 | 22,988 | 24,274 | 23,049 | 22,803 | 24,229 | 25,520 | 22,310 | 18,915 | 17,332 |
| Jewellery store | Semrush | 65,620 | 64,828 | 55,270 | 49,496 | 50,909 | 41,670 | 35,507 | 44,627 | 47,756 | 45,507 | 47,446 | 45,261 | 41,113 | 43,165 |
| Skates and scooters | Search Console | 4,848 | 4,344 | 4,314 | 5,012 | 5,698 | 6,358 | 6,865 | 11,051 | 10,718 | 10,608 | 8,547 | 8,781 | 8,993 | 9,213 |
| Skates and scooters | SE Ranking | 2,080 | 1,592 | 2,163 | 2,255 | 1,946 | 1,889 | 3,284 | 4,310 | 4,824 | 4,125 | 4,090 | 4,101 | 3,380 | 4,712 |
| Skates and scooters | Semrush | 3,401 | 4,783 | 1,641 | 2,201 | 2,693 | 3,173 | 7,249 | 9,723 | 9,258 | 12,964 | 12,288 | 9,690 | 10,124 | 13,151 |
Direction match (whether traffic goes up or down from one month to the next) averages 6 out of 13 months for both tools. That's coin-toss territory. Correlation with the real curve is weak: an average of 0.23 for Semrush and 0.14 for SE Ranking (0.36 if you shift SE Ranking by one month; it looks like its “month” is when the data was collected, not when the traffic happened).
Three cases I'd show anyone who builds client reports off a chart from one of these tools:
- Our site, June 2026. SE Ranking drew 143,866 visits, with 1,967 in May and 1,543 in July. Search Console for June: 1,490 clicks. A 93x spike that never happened. The screenshot below is our actual dashboard, not Photoshop.
- Windows and doors. Semrush shows traffic cut in half (2,961 in January, 1,303 in September). Per Search Console, clicks over the same period grew from 1,525 to 2,860. An owner who only looked at Semrush would have fired their agency during the site's best year.
- Generator rental. In the winter of 2025–2026 this business peaked because of rolling blackouts: 18,245 clicks in January, then a slide to 1,445 in May. SE Ranking caught the winter peak (6,891 in January). Semrush drew a smooth decline all winter long.
The tools are upfront that their traffic numbers are estimates. In March of last year, going over the downsides of Ahrefs, I put it this way:
“Many Ahrefs metrics, like traffic and keyword positions, are based on assumptions, not real data. Yes, they take data from the GSC of users who voluntarily added authorization of their sites there. BUT, everything else - they guess.”
That's true of all three big tools, and our test puts numbers on it. Track your own site's trends only in Search Console and your analytics. You can watch a competitor's trend in a tool, just don't draw conclusions from a single month: wait until a change holds for at least two or three snapshots.
Backlinks: 43 trillion vs. 2.9 trillion
By the vendors' own claims, Semrush's backlink database holds more than 43 trillion backlinks, and SE Ranking's holds 2.9 trillion plus 411 million referring domains. A 15x gap looks decisive, but on an actual site it plays out differently.
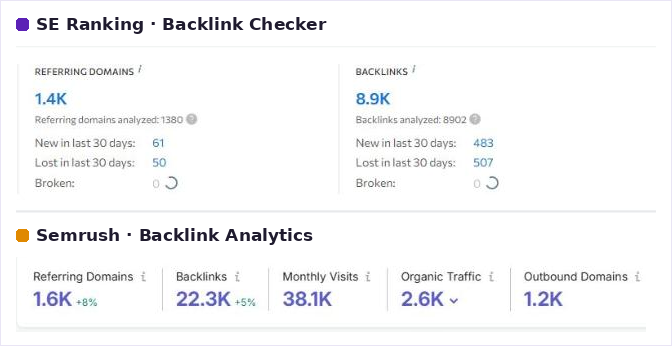
On referring domains the gap is 14%; on backlinks it's 2.5x. Part of that is sitewide links and scraper pages: one database counts them, the other throws them out. SE Ranking recently purged links like these from its database and warns about it with a banner in the dashboard: “You may have noticed some changes in the number of backlinks and DT value. This is because we removed many outdated, disruptive backlinks from the new database.”
For link building, the size of the database matters less than how clean the list of referring domains is. That's exactly why I gave SE Ranking first place on backlinks last year: its report is faster to work through. If you need every last one of a competitor's links, junk included, Semrush will find more. For how we vet sites and why only 8 out of 1,453 were worth paying for, see our page on link building.
AI visibility: what they actually measure
Over the past year both tools have rebuilt themselves around AI search. Semrush has been owned by Adobe since April 2026, and in the deal-closing announcements the company talks openly about “brand visibility” in ChatGPT and AI Overviews. SE Ranking launched a separate AI Search module that tracks mentions in AI Overviews, AI Mode, ChatGPT, Perplexity, and Gemini.
Here's what they show for our site in Ukraine:
| Metric | SE Ranking | Semrush |
|---|---|---|
| Brand mentions in AI answers | 17 | 2 |
| Site citations in answers | 811 | 21 pages (ChatGPT 7, AI Overview 8, AI Mode 4, Gemini 6) |
| Estimated traffic from AI Overviews | 654 | — |
| Overall score | — | AI Visibility 14 out of 100 |
| Prompts you can track | 100 on the Core plan | starting with the $199 Starter plan: 50 prompts |
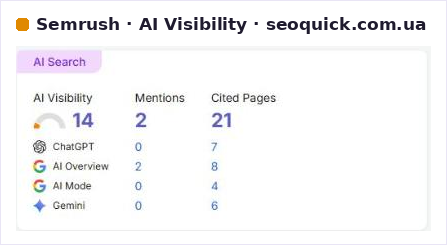
You can't compare these numbers head to head: the tools run different query sets and count a mention differently. The gap between SE Ranking's 811 citations and Semrush's 21 comes from different prompt samples, not sharper eyesight. Inside a single tool the metric is useful: you can see whether your share is growing and which pages get cited. That's where we started ourselves when we were figuring out why AI doesn't name your brand.
API and MCP: how AI assistants work with these tools
This article is itself an example of what this chapter is about. I didn't put together the comparison of 27 sites, 14 months of history, and 261 queries by hand. An AI assistant did: it went into Search Console through the API, pulled the data from both tools, built the tables, and calculated the errors. It took a couple of hours instead of a week. But the two tools are set up very differently for this kind of work.
API and MCP in a nutshell
An API is a way for a program to get a tool's data without the interface. You send a request like “give me a domain overview” and get a table back. Agencies have used this for years to build reports and dashboards.
MCP (Model Context Protocol) is a newer layer on top of the API, built specifically for AI models. The tool describes its functions so the model can figure out on its own what it can ask for and with which parameters. You connect the server in Claude, ChatGPT, Cursor, or another client and ask in plain English: “compare the visibility of seoquick.com.ua and three competitors in Ukraine and show me which queries they beat us on.” The model picks the calls it needs, gets the data, and answers.
For a business owner, that's a big shift. Getting a non-standard report used to mean hiring a developer. Now an assistant builds it in minutes, as long as the tool has MCP and you've paid for it.
SE Ranking: API and MCP come with the plan
The $129 Core plan already includes 25,000 API credits a month and MCP access. The API is also sold separately in several ways:
| Option | Price | Credits | What's included |
|---|---|---|---|
| Free trial | free | 100K for 14 days | all methods and MCP |
| Wallet | $50 | 250K, never expire | pay as you go |
| Add-on to a Core/Growth subscription | +$45 a month, billed annually | 3M a year | Data API and Project API |
| Standalone API, no dashboard | $179 a month, billed annually | 12M a year | Data API only |
| Enterprise | custom | from 120M a year | from $30 per million credits |
What the main requests cost, per SE Ranking's own table: a domain overview for one country is 100 credits, domain history 100, a domain keyword list 100 per request, a backlink summary 100 per domain, a full backlink list 1 credit per row, an AI visibility summary across all AI engines 1,800, and the AI search brand leaderboard 7,500. Failed requests aren't charged.
What SE Ranking's MCP can do, judging by the set of tools the assistant sees:
- Data: domain overview by country and worldwide, history, domain keywords and pages, competitors, keyword comparison between two domains, search volume and similar queries, questions, the Google SERP for a query, backlinks, anchors, referring domains, a full site audit.
- AI search: brand visibility in AI Overviews, AI Mode, ChatGPT, Perplexity, and Gemini, the prompts where your brand gets mentioned, and the sources AI engines cite.
- Projects: not just reading but creating projects, adding keywords and competitors, running rank checks, and keeping a marketing plan. The assistant can set up rank tracking by itself.
- Local module: business listings and reviews in Google Business Profile.
The responses are easy for a model to work with: history comes back as a ready-made time series, and the keyword table as a table with labeled columns. There are downsides too. The history response for a single domain weighs a few kilobytes, so if you ask the assistant to go through a hundred sites, it'll run into its own context window fast. Big jobs are better split into batches.
SE Ranking has published ready-made workflows for Claude on GitHub (so-called Skills): a copywriter brief from a domain and topic, an AI search share-of-voice map against competitors, and a technical audit with the ten most important fixes. They're a good starting point if you haven't worked with MCP before.
Semrush: MCP is there, but you pay extra
Semrush also has an official MCP server, and it's built differently. Instead of dozens of separate tools, it works in three steps: a catalog tool for each section (domain overview, organic, keywords, competitors, backlinks, audience, traffic, ads, position tracking, site audit), then a schema request for a specific report, then the report itself. The model needs one or two extra calls, but it doesn't have to know the reports in advance: the catalog describes itself. Projects are read-only through MCP, so the assistant can't set up tracking for you.
Semrush has official apps in Claude, ChatGPT, and Perplexity, plus a connector for Cursor and VS Code. On that front, Semrush is every bit as ready as SE Ranking.
The problem is money. Semrush's MCP and API run on API units, and every report costs units: one row of a domain's organic keywords is 10 units (50 for historical data), one “domain vs. domain” row is 80, backlinks run 1 to 45 per row.
Where those units come from is still a bit of a mess. The API docs say you can buy units on the Business plan. The MCP docs say the Starter and Pro+ plans already include 50,000 units. If you're buying Semrush to work through an AI assistant, ask Semrush exactly how many units your plan comes with before you pay. Without units, the MCP server will connect but won't return any data.
Side by side, for anyone who'll be working with an assistant
| SE Ranking | Semrush | |
|---|---|---|
| API access on the base plan | yes, 25K credits on Core | no; units start with the Business plan (per the MCP docs, 50K on Starter and Pro+) |
| Official MCP | yes, on all plans | yes, mcp.semrush.com, units required |
| How the tools are organized | a separate tool for each report | catalog → report schema → report |
| Write access via MCP | yes: projects, keywords, rank checks | no, projects are read-only |
| AI visibility via API | yes, 800–7,500 credits per report | no dedicated section in MCP |
| Standalone API without a dashboard | from $179 a month | no; traffic by channel is a separate Trends API |
| Ready-made assistant workflows | open Skills for Claude on GitHub | official apps in Claude, ChatGPT, Perplexity |
What an assistant with MCP actually does for a business
A few jobs we now handle with a single request to the assistant instead of a full day of a specialist's time:
- Weekly summary. “Which of our pages lost rankings this week, which competitors grew over the same period, and what did they change on those pages.” The assistant pulls rankings from the project and competitors from the database, then compares the pages.
- Article brief. Topics, questions, the competitors in the top results, and which of them AI Overviews cite. That's how we prep this blog.
- Checking your contractor. The owner asks the assistant to cross-check the agency's report against the tool's data and Search Console. Yes, that works against us too, and that's fine.
- Scouting a niche before launch. Who's at the top, how many backlinks they have, which pages bring them traffic, whether marketplaces show up in the results.
And the main rule that falls out of this whole article: give the assistant access to both the tool and Search Console. The tool answers “what do competitors have,” Search Console answers “what do we actually have.” An assistant that only sees the tool will confidently repeat the tool's mistakes back to you.
Pricing and limits
Prices from the vendors' pages as of October 23, 2026:
| Plan | Monthly | Billed annually | Keywords tracked daily | Sites/projects | AI prompts | API |
|---|---|---|---|---|---|---|
| SE Ranking Core | $129 | $103.20 | 2,000 | 10 | 100 | 25K credits + MCP |
| SE Ranking Growth | $279 | $223.20 | 5,000 | 30 | 250 | 100K credits + MCP |
| Semrush SEO | $139 | $117.33 | 500 | 5 | — | no |
| Semrush Starter (SEO + AI Search) | $199 | $165.17 | 500 | 5 | 50 | per the MCP docs, 50K units |
| Semrush Pro+ | $299 | $248.17 | 1,500 | 15 | 100 | same |
Run the math on rank tracking and the gap gets big. Tracking 1,000 keywords daily costs about $65 a month on SE Ranking Core, about $278 on Semrush SEO, and about $199 on Pro+. AI visibility tracking is cheaper with SE Ranking too: 100 prompts are already in Core, while Semrush's first 50 come with the $199 plan. An extra user on Semrush starts at $45 a month.
Where Semrush's higher price does pay off: the Traffic & Market module with whole-site traffic estimates by channel, competitors' PPC ads, the content tools, and historical data. If you really use those modules, price per keyword is the wrong yardstick.
A small thing that says a lot about how pricing works in this market: SE Ranking's rank tracker page still says “subscriptions starting at $119/month,” while the pricing page says $129. In our Ahrefs alternatives piece we counted 13 wrong prices out of 20 on comparison pages. Before you buy, check the price on the vendor's own pricing page, not in a review.
Which one to pick for which job
| Your job | What fits | Why |
|---|---|---|
| Your site targets Ukraine and you need keyword research and competitor analysis | SE Ranking | sees many times more Ukrainian keywords; its search volume was more accurate in our test |
| Going after the US, Europe, or other markets outside Ukraine | Semrush | traffic estimates outside Ukraine were closer to reality in 7 cases out of 8 |
| Rank tracking for several sites | SE Ranking | 3–4x cheaper per keyword |
| Reports and analytics through an AI assistant | SE Ranking | API and MCP on the base plan, and its MCP can create projects |
| Competitor PPC ads, traffic by channel, content marketing | Semrush | modules SE Ranking either doesn't have or does less well |
| Backlink audit where you need maximum coverage | Semrush | a 15x bigger backlink database, but be ready to clean out the junk |
| Vetting sites for link building | SE Ranking | cleaner list, faster to work through |
| Finding out whether your site is growing | neither | Search Console and analytics are free and accurate |
If I had to pick one and only worked in Ukraine, I'd start with SE Ranking: more Ukrainian keywords, more accurate volume, cheaper tracking, and an API with no upcharge. If your market is abroad, the US included, start with Semrush. If it's both, grab both on a trial and run the test from the next section.
How to test both on your own site in 15 minutes
SE Ranking gives you a 14-day free trial with no credit card; Semrush gives you 7 days. That's enough to test both on the one site where you know the right answer: your own.
- Open Search Console → “Performance” for the last 28 days and filter by your country. Write down the clicks.
- Open your domain overview in both tools, using your country's database. Write down the organic traffic estimate. Divide it by your Search Console clicks: that's each tool's correction factor for your market.
- In Search Console, filter for queries with an average position of 1.5 or better. Take the ten with the most impressions and check their search volume in both tools. Count how many times each tool was off by more than 2x and how many queries it doesn't know at all.
- Pull up the past year of your domain's traffic history in the tool and put your Search Console clicks chart next to it. If the tool shows a spike or a dip that never happened, you know how far to trust its charts about your competitors.
- If you plan to work through an assistant, connect MCP during the trial and ask it to build a report from steps 2–3. You'll see right away whether the credits or units are enough.
If you'd rather not do it yourself, our free website audit will show you the technical state of your site, and on a consultation call we'll check the tools' data against your Search Console and tell you which numbers you can trust in your niche.
FAQ
Which is more accurate for competitor traffic, SE Ranking or Semrush?
In Ukraine, neither one consistently: in our test the score was 10:9, and both tend to lowball. Outside Ukraine, including the US and Europe, Semrush is more accurate. Compare sites inside one tool and don't mix numbers from the two.
Can I connect SE Ranking or Semrush to ChatGPT and Claude?
Yes, both have official MCP servers. With SE Ranking, access comes with the Core plan. Semrush needs API units: per the docs they come with the Starter and Pro+ plans or are bought on Business, so check before you pay.
Why does SE Ranking show dozens of times more keywords for my site than Semrush?
SE Ranking digs deeper into the Ukrainian long tail: for our clients it's 18.8x more keywords on average. Most of those rankings sit at the bottom of the top 100 and bring no clicks, so they barely move the traffic estimate.
Further reading
- Ahrefs alternatives, tested on real data: Serpstat, SE Ranking, and Semrush on seven Ukrainian sites, plus real prices
- Google Search Console: the complete guide: how to get everything out of it that you need to check the tools
- How to check website traffic: your own and your competitors', and where each method hits its limit
- Link building: how we vet sites and what a link really costs
- Building a semantic core: if you need keywords for a Ukrainian-language version, where the tools go quiet
Prices and limits here come from the vendors' own pages as of October 23, 2026, and both databases refresh every month. If you spot a number that's gone stale, drop me a line and I'll update the tables and charts. And if you want someone to check these tools against your own Search Console, book a call.
Ahrefs Alternatives 2026: Real Prices and Real Data
Semrush, SE Ranking, Serpstat and free tools, checked against vendor price pages and our own analytics: 13 of 20 quoted prices are wrong.
Read →
Content Refresh in 2026: How to Revive Old Posts and Win Traffic Back
Updating old articles is more profitable than writing new ones. How to pick pages in Search Console, rewrite the content and win traffic back — the SEOquick method with data and quotes.
Read →
How to Check and Estimate Website Traffic: Yours and Your Competitors'
How to check your own website traffic and your competitors': GA4, Search Console, Similarweb, Ahrefs, Serpstat — plus how to track visits from ChatGPT and AI search.
Read →Want to apply this to your site?
We will review the current situation, find the first growth levers, and suggest a practical working format.